
Bitcoin Trend Analysis, September 2026: Above the 200-Day Average, Liquidation Zones at $70K and $84K
Published 2026-09-18 · analysis data as of 2026-09-18 UTC · BTC live price $83,097.22
Bitcoin enters the second half of September 2026 in a very different place from where it started the summer. After bottoming near $57,800 on 1 July 2026, BTC has climbed back above every major daily moving average and is pressing on the top of its 30-day range. This piece walks through the trend structure, the derivatives data behind it, and the liquidation zones that will likely decide the next leg. All figures are a snapshot taken on 2026-09-18; the live price above updates hourly.
Snapshot: where Bitcoin stands
| Metric (2026-09-18) | Value |
|---|---|
| BTC/USDT daily close | $78,305 |
| Change over 7 / 30 / 90 days | +1.4% / +12.9% / +21.8% |
| Change over 1 year | -33.1% |
| 20 / 50-day moving average | $78,035 / $72,452 |
| 100 / 200-day moving average | $67,953 / $70,420 |
| 30-day range | $68,900 – $82,300 |
| Cycle high / low (last 400 days) | $126,200 (6 October 2025) / $57,800 (1 July 2026) |
Source: Binance BTC/USDT daily candles, computed on 2026-09-18. Moving averages are simple averages of daily closes.
Trend structure: back above the 200-day
The cleanest way to describe the daily trend is by the order of the moving averages. Price ($78,305) sits above the 20-day ($78,035), which sits above the 50-day ($72,452), which in turn has crossed back above the 200-day ($70,420). That is the textbook bullish alignment, and it was not the case for most of the spring and early summer, when BTC spent weeks below the 200-day after the slide from the October 2025 high.
Two caveats keep this from being an all-clear. First, the 100-day average ($67,953) is still below the 200-day, a reminder that the recovery is only about eleven weeks old. Second, the market is up a modest +1.4% over the last week and has stalled just under $82,300, the 30-day and 90-day high. Until that level breaks on a daily close, the last month reads as consolidation at the top of a rally rather than continuation. On the yearly view BTC is still down -33.1% and roughly 38% below its all-time high, so the larger structure is a drawdown that is being repaired, not a new expansion phase.
Derivatives: leverage rebuilt, then trimmed
Futures data explains why the rally has been orderly. Open interest on the Binance BTCUSDT perpetual rose from about $7.45billion on 20 August to $9.16 billion on 4 September, then slipped back to $8.27 billion by 2026-09-18. Measured in coins rather than dollars, open interest is essentially flat over the month (about 107,490 to 108,245 BTC), so most of the dollar increase was price marking up existing positions, and the early September spike in leverage has already been flushed.
Funding confirms the lack of froth. The perpetual’s funding rate averaged about 0.006% per eight-hour period over the last 30 settlements, and the latest print was 0.0074%. Both are below the 0.01% neutral baseline that exchanges default to, meaning longs are paying almost nothing to stay in. Rallies that end in liquidation cascades usually come with funding several times higher than this.
Positioning is the one crowded reading. Around 59.1% of Binance futures accounts are net long, and top traders hold roughly 70.2% of their position value on the long side. Cheap funding plus a long-heavy crowd is a stable mix while price grinds up, but it also means a sharp move down would hit a lot of positions at once, which is exactly what the liquidation heatmap shows.
The BTC liquidation heatmap: magnets above and below
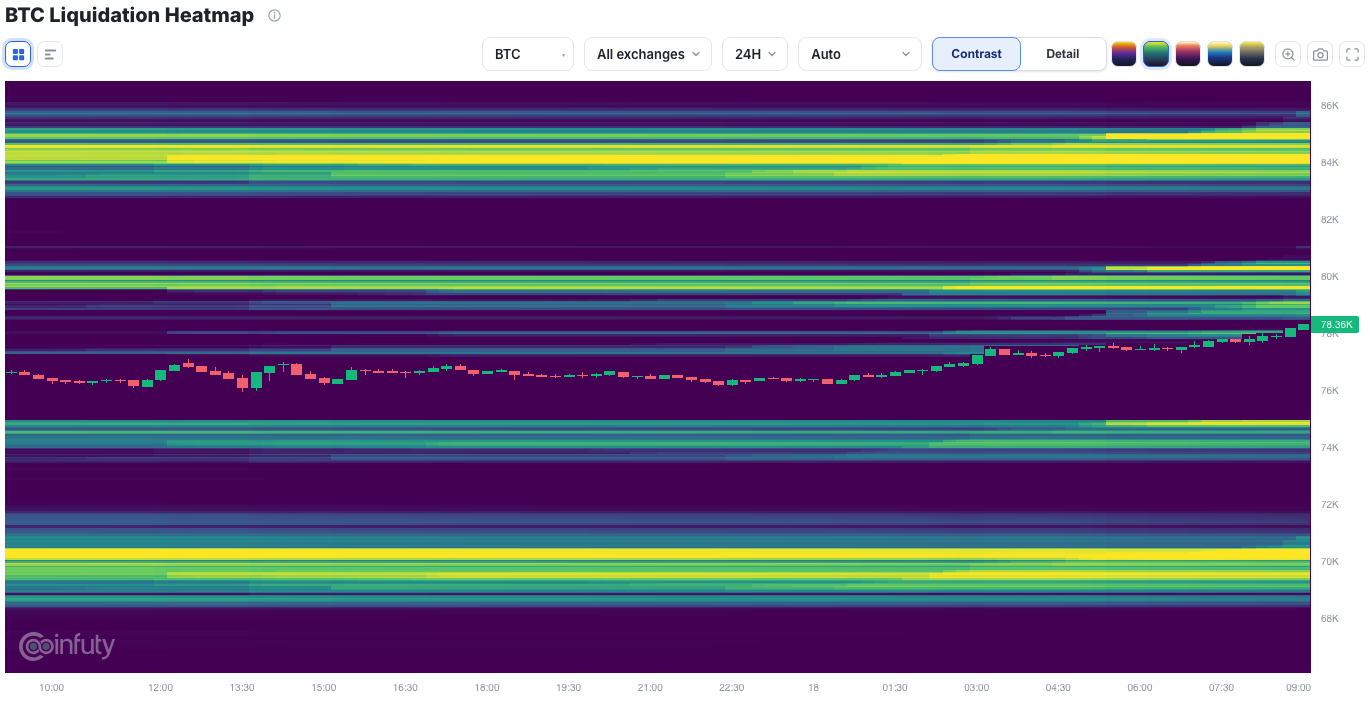
The heatmap estimates where leveraged positions would be forcibly closed, by price and time, from open-interest changes and price action. With BTC at about $78,300 on the snapshot, four bands stand out:
- $84,000–85,000 (shorts): the brightest cluster on the map and the largest pool of at-risk notional above price. It has persisted through the whole 24-hour window, which usually means shorts placed against the range high with modest leverage. A daily close above $82,300 would put this zone in play as a short-squeeze target.
- $79,500–80,000 (shorts): a nearer, thinner band that built up during the late rally on the right side of the chart. It is the first magnet overhead and explains why price has been drifting up into it.
- $74,500 (longs): the first meaningful long cluster below, about 5% under price. A dip into it would flush the most recent leveraged longs without damaging the trend, since the 50-day average sits just below.
- $70,000–71,000 (longs): the heaviest zone under price, and it lines up almost exactly with the 200-day average at $70,420. That confluence makes it the level that matters most: a break of it would mean both a trend failure and a liquidation cascade at the same time.
Three scenarios into October
- Continuation (breakout above $82,300): a daily close over the range high with funding still below 0.01% would be the healthiest version of the rally. The short clusters at $84,000–85,000 are the natural first target, and forced short covering there could carry price quickly, since there is very little estimated liquidity between $80,000 and $84,000 on the map.
- Range (roughly $74,000–82,000): the base case while the 90-day high holds. Open interest that is flat in BTC terms and funding near zero describe a market content to wait. Expect the $79,500–80,000 and $74,500 bands to get tested and refilled several times.
- Failure (loss of $74,500, then $70,000): the crowded-long risk. Losing the $74,500 cluster would drop price onto the 50-day average, and a move through the $70,000–71,000 zone would liquidate the largest long pool on the map while breaking the 200-day. Given how many accounts are positioned long, this is the scenario with the most forced selling attached, even if it is not the most likely one.
What it costs to trade the view
Whatever the scenario, the trade has a price. Perpetual futures fees apply to the full notional on entry and exit, so a 0.05% taker fee on 10× leverage costs 0.5% of margin per side, and funding accrues every eight hours while the position is open. Compare the regular-tier BTC trading fees by exchange and run the position through the futures fee calculator before sizing it.
For spot holders taking profit or moving coins to cold storage, the exit fee matters too. Right now the cheapest open BTC withdrawal on the Bitcoin network we track is $0.01246 on Blockfinex, against a median of $1.66 across all open routes and networks (synced 2026-08-29 00:57 UTC). The full per-exchange list is on the Bitcoin withdrawal fee page.
FAQ
Is Bitcoin in an uptrend in September 2026?
On the daily chart, yes: as of 18 September 2026 BTC trades near $78,300, above its 20, 50, 100 and 200-day moving averages, and the 50-day average has crossed back above the 200-day. Price is up roughly 13% over 30 days and 22% over 90 days from the 1 July low near $57,800. It is still about 38% below the October 2025 high of $126,200, so this is a recovery inside a larger drawdown rather than a new all-time-high trend.
What do the liquidation zones on the BTC heatmap mean?
A liquidation heatmap estimates the price levels where leveraged futures positions would be forcibly closed. Bright bands below the current price mostly hold leveraged longs, bands above hold shorts. On the 18 September snapshot the densest clusters sit around $84,000–85,000 above price and $70,000–71,000 below, with lighter bands near $79,500–80,000 and $74,500. Dense zones often act as magnets because liquidations accelerate a move once it reaches them.
Is the futures market overheated?
Not by funding. Binance BTCUSDT perpetual funding averaged about 0.006% per 8-hour period over the last 30 settlements, below the 0.01% neutral baseline, so longs are paying very little to hold. Positioning is the more crowded signal: roughly 59% of accounts and 70% of top-trader positions are long, which raises the cost of a sharp drop into the $70,000–71,000 long liquidation zone.
Is this investment advice?
No. This is a dated, data-driven description of price structure and derivatives positioning as of 18 September 2026, using public Binance data and Coinfuty's liquidation heatmap. Markets move; check the live sources before acting, and size any position with fees and funding included.
Data: Binance BTC/USDT spot daily candles and USDT-M futures funding, open interest and long/short ratios, 2026-09-18 UTC; BTC liquidation heatmap by Coinfuty. This article is market commentary, not investment advice. Related: trading fees explained · how to pay less in fees.